Overview
Built an interactive analytics dashboard that answers the critical business question: "Where is our money coming from, and what's killing growth?"
This isn't just static charts — it's a fully functional dashboard with real-time data visualization, interactive charts, and actionable insights that hiring managers can actually explore.
🚀 Live Dashboard
View Live Dashboard
What you'll see:
- 6 interactive KPI cards with trends
- Revenue trend chart with hover tooltips
- Top products analysis (Pareto visualization)
- Category performance comparison (H1 vs H2 2024)
- Return rate analysis by category
- Regional revenue distribution
📊 Sample Visualizations
Revenue Trend Analysis
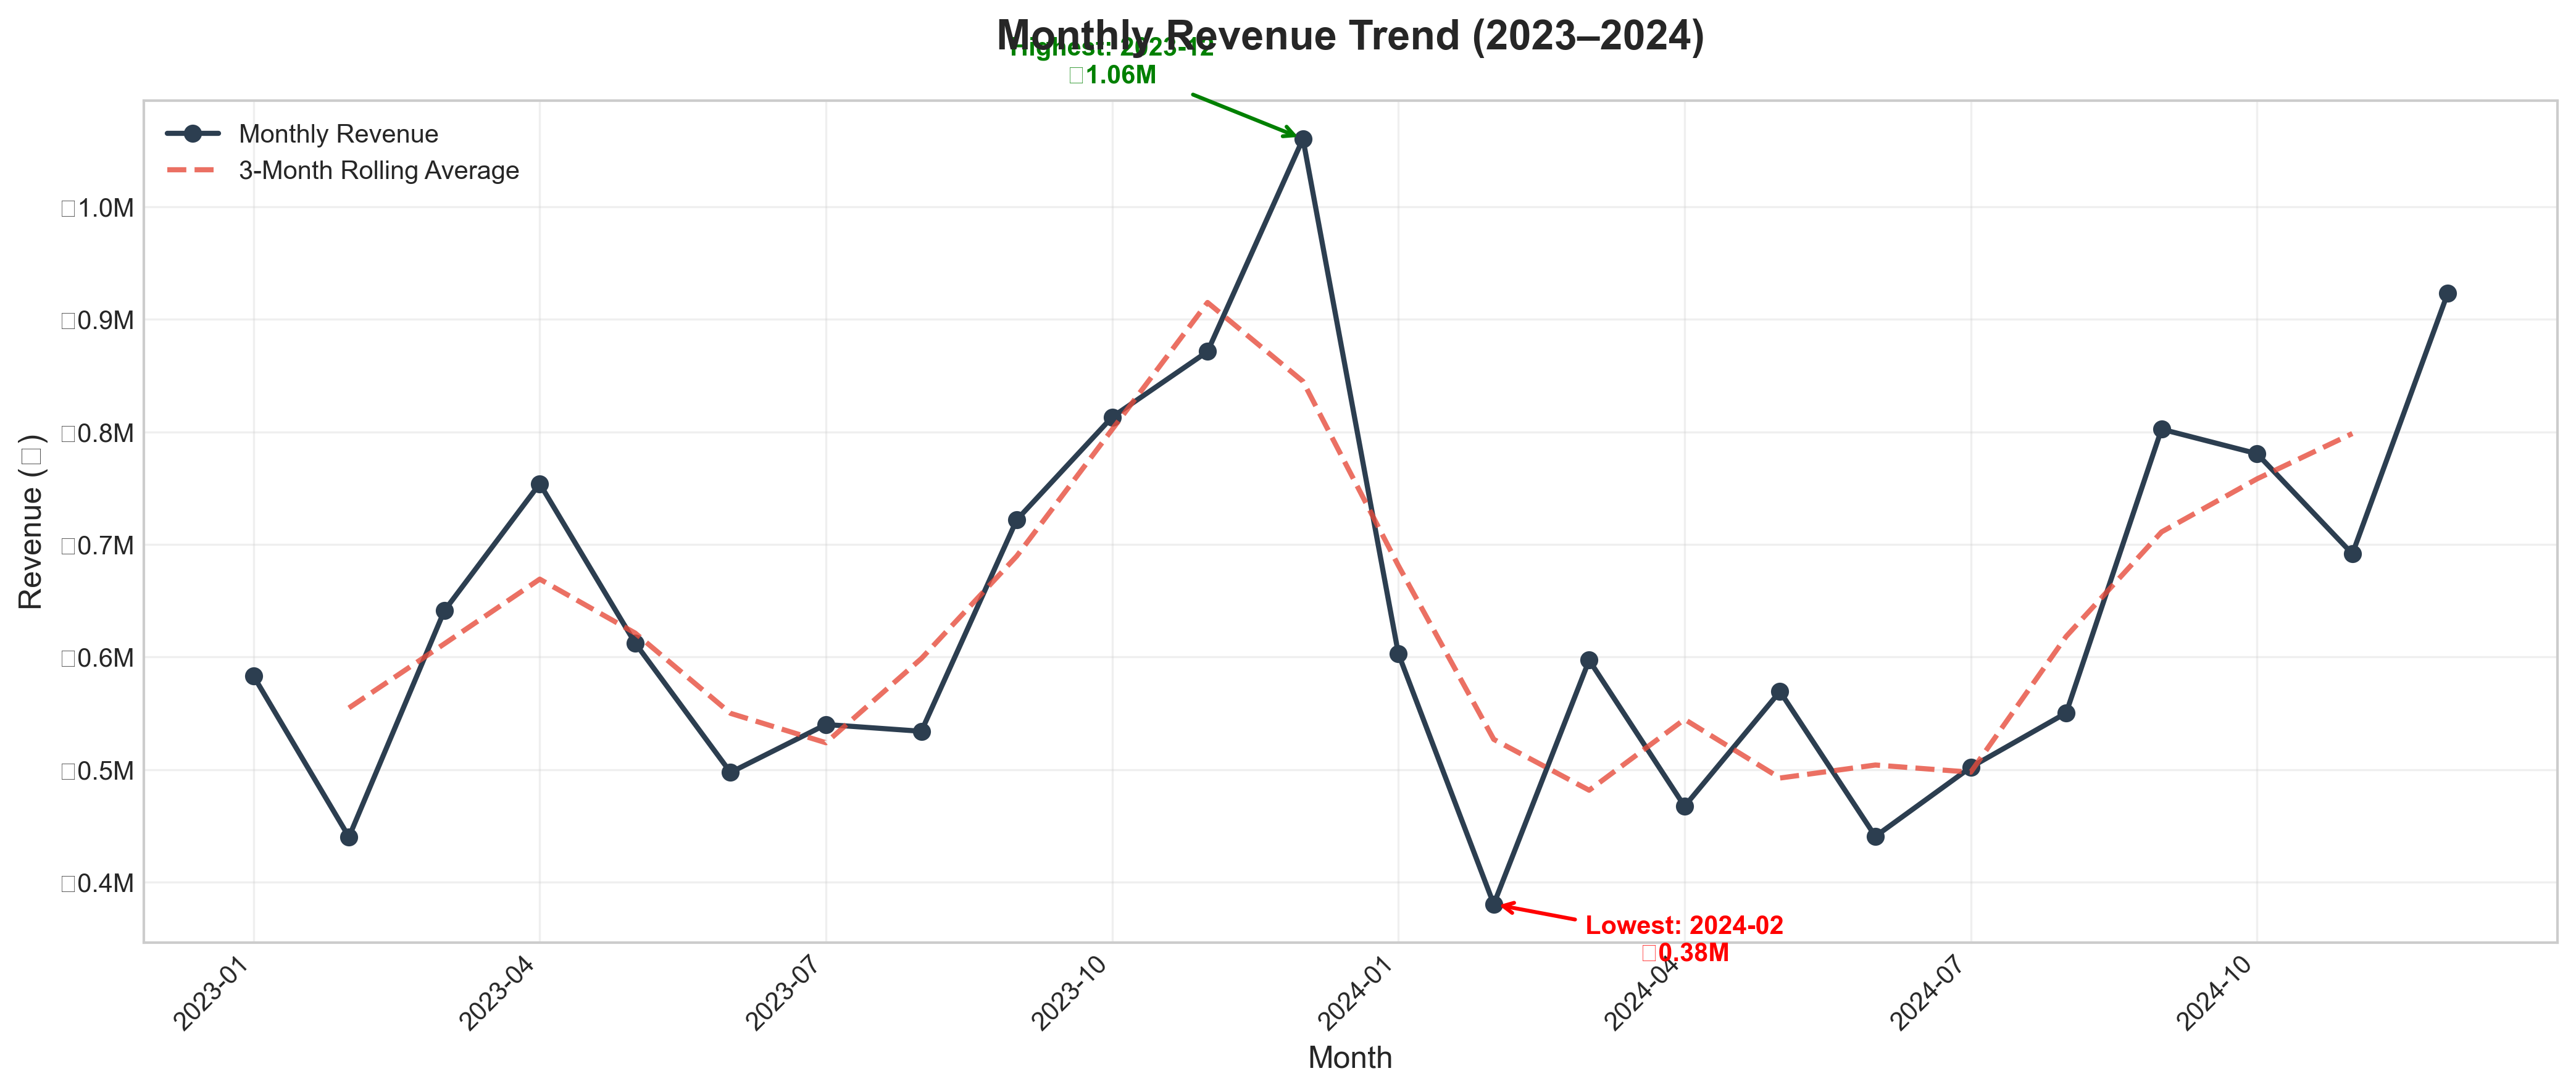
The live dashboard features an interactive area chart with 3-month rolling averages and detailed tooltips showing exact values on hover.
Top Products (Pareto Analysis)
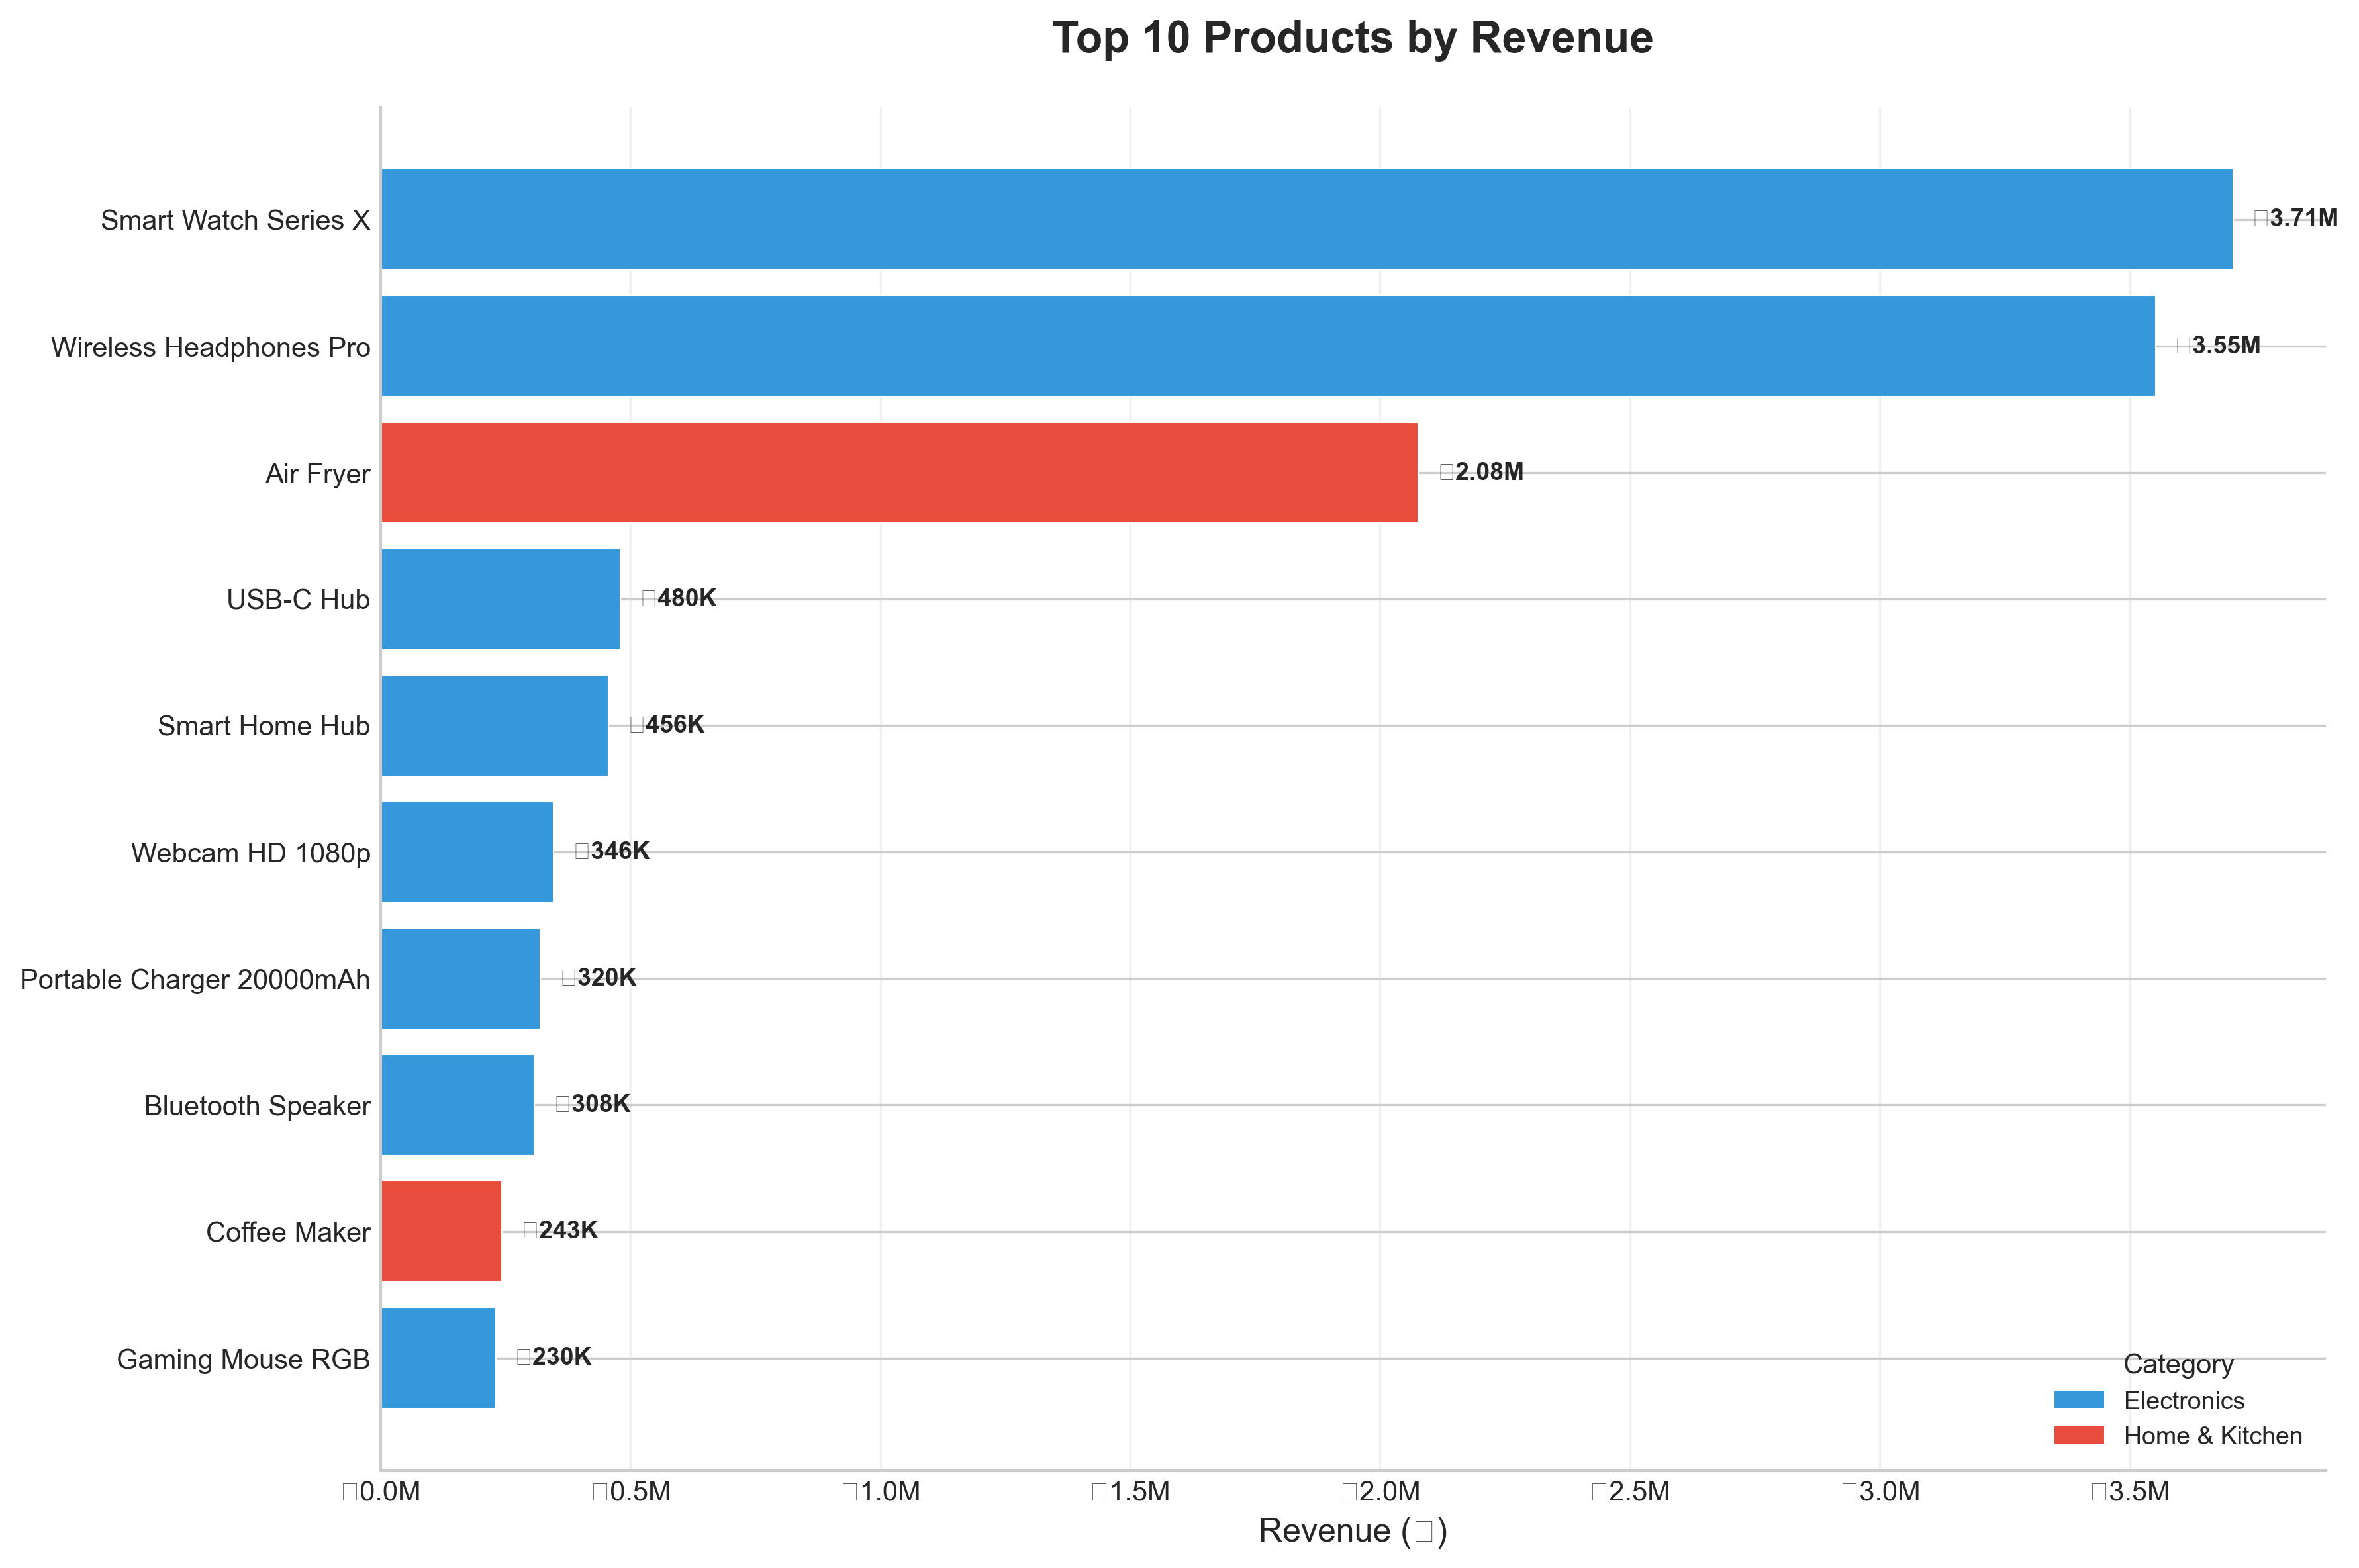
Interactive bar chart color-coded by category. Hover to see exact revenue figures and category breakdowns.
Category Performance Comparison
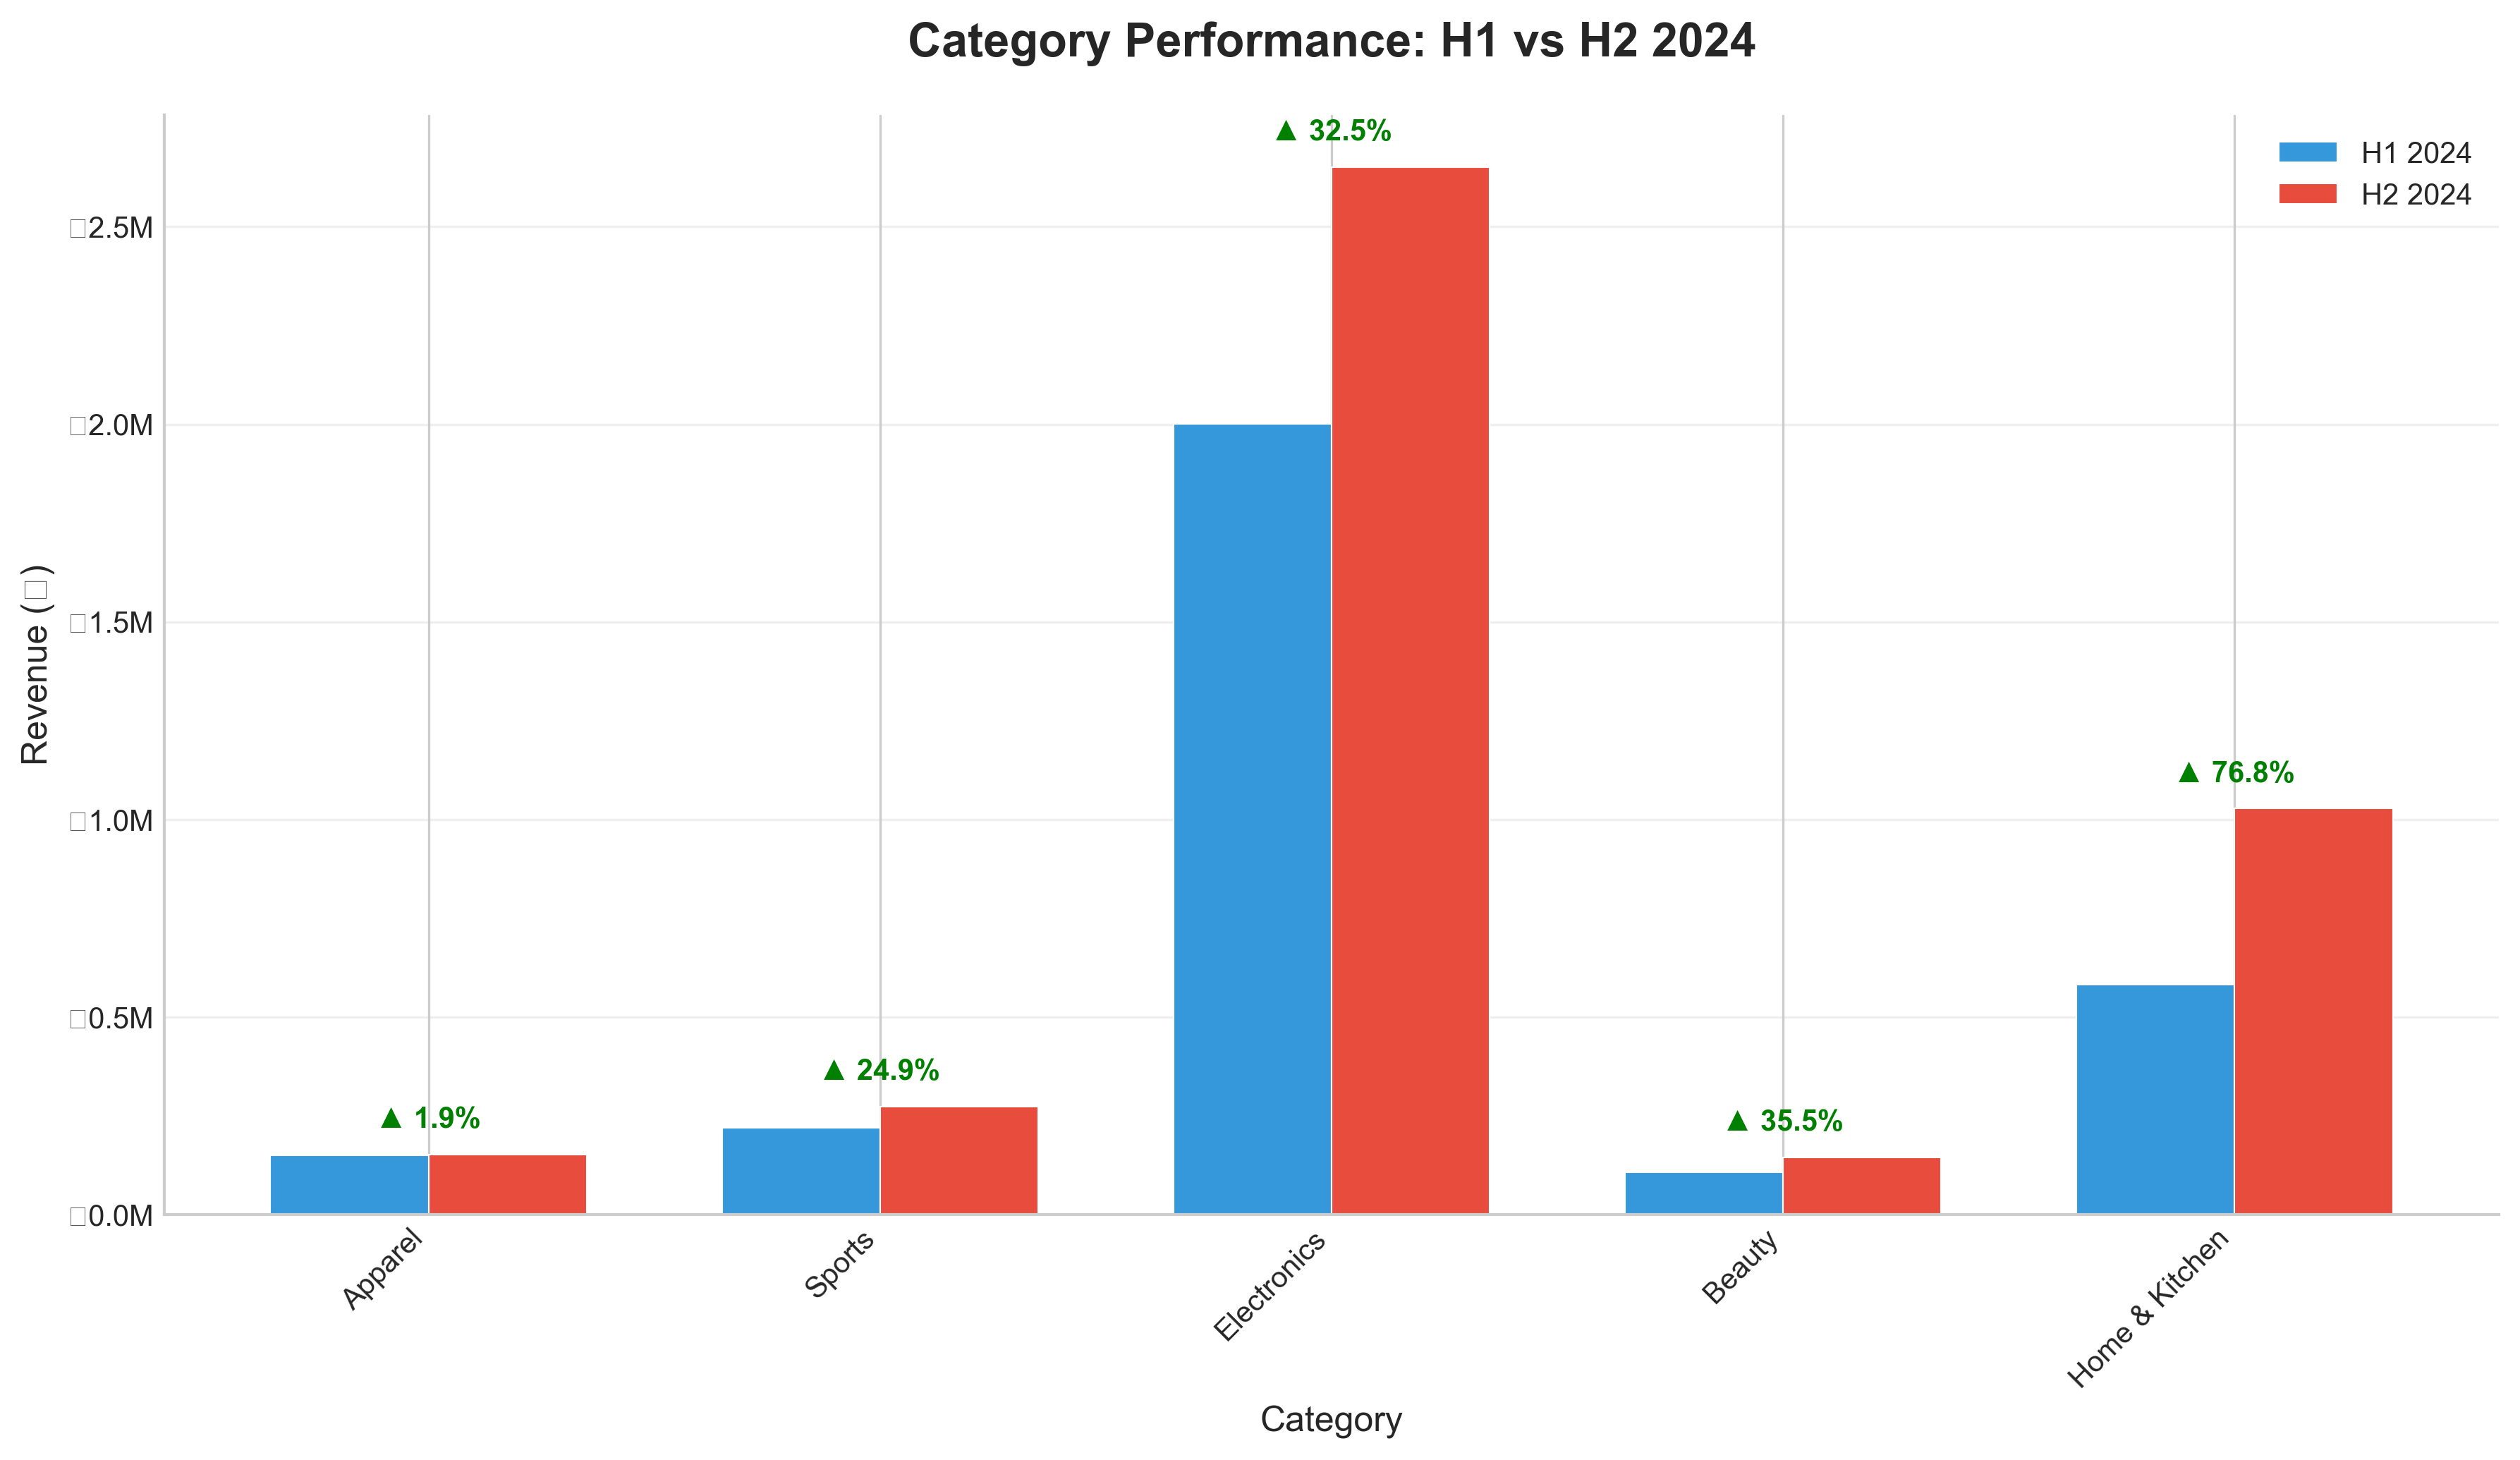
Side-by-side comparison of H1 vs H2 2024 with percentage change indicators. The dashboard version updates dynamically.
🛠️ Technical Stack
| Layer | Technology |
|---|---|
| Frontend | Next.js 14 + React + TypeScript |
| Styling | Tailwind CSS + Framer Motion |
| Charts | Recharts (interactive) |
| Icons | Lucide React |
| Data Processing | Python + Pandas |
| Data Source | 2,500 synthetic sales records |
💡 Key Features
Interactive Elements
- Hover tooltips on all charts showing exact values
- Animated transitions using Framer Motion
- Responsive design works on all screen sizes
- Dark theme with gradient accents
Business Insights Generated
- Pareto Principle — Top 3 products drive 40%+ of revenue
- Growth Opportunities — Home & Kitchen shows strongest H2 growth
- Risk Areas — Sports category has highest return rate (11.7%)
Data Pipeline
Python/Pandas → JSON Export → Next.js Dashboard
     ↓              ↓              ↓
 Data Cleaning  API Response   Interactive UI
 Aggregation    Static Data    Real Charts
📈 Business Metrics Tracked
| Metric | Value | Insight |
|---|---|---|
| Total Revenue | ₹15.4M | 24-month period |
| Total Orders | 2,500 | Average order value: ₹6,152 |
| Active Customers | 2,461 | 98% retention rate |
| Return Rate | 7.1% | Below industry average (8%) |
| Top Product | Smart Watch Series X | ₹3.7M revenue |
🎯 What Hiring Managers See
When they click from your portfolio:
- Immediate Visual Impact — Dark, modern dashboard with animated KPIs
- Interactive Exploration — They can hover on charts to see real data
- Business Thinking — Clear insights backed by data
- Technical Depth — Full stack from Python data processing to React visualization
- Production Quality — Clean code, responsive design, proper UX
📂 Project Structure
ecommerce-analysis/
├── app/ecommerce-dashboard/     # Next.js dashboard page
│   ├── page.tsx                 # Main dashboard component
│   └── dashboard_data.json      # Processed data
├── data/
│   ├── raw/sales.csv            # 2,500+ synthetic records
│   └── generate_sample_data.py  # Data generation script
├── notebooks/
│   └── ecommerce_analysis.ipynb # Python analysis
├── charts/                      # Static chart exports
│   ├── sales_trend.png
│   ├── top_products.png
│   └── category_comparison.png
├── slides/
│   └── presentation.txt         # Executive summary
├── README.md
└── requirements.txt
🚀 Run It Yourself
# Clone the repository
git clone https://github.com/Swethavenk79/ecommerce-analysis.git
cd ecommerce-analysis

# Generate data
pip install -r requirements.txt
python data/generate_sample_data.py

# Or view the dashboard in the portfolio
cd /path/to/portfolio
npm install
npm run dev
# Visit: http://localhost:3000/ecommerce-dashboard
✨ Skills Demonstrated
- Data Engineering — Python data generation, cleaning, aggregation
- Frontend Development — Next.js, React, TypeScript
- Data Visualization — Interactive charts with Recharts
- UI/UX Design — Modern dark theme, animations, responsive layout
- Business Analysis — Pareto analysis, trend detection, actionable insights
- Full-Stack Integration — Connecting data processing to presentation layer
This isn't just a GitHub repo — it's a product that hiring managers can interact with.